Key points
- URA splits the private housing market into three segments: CCR (prime), RCR (city fringe) and OCR (suburbs).
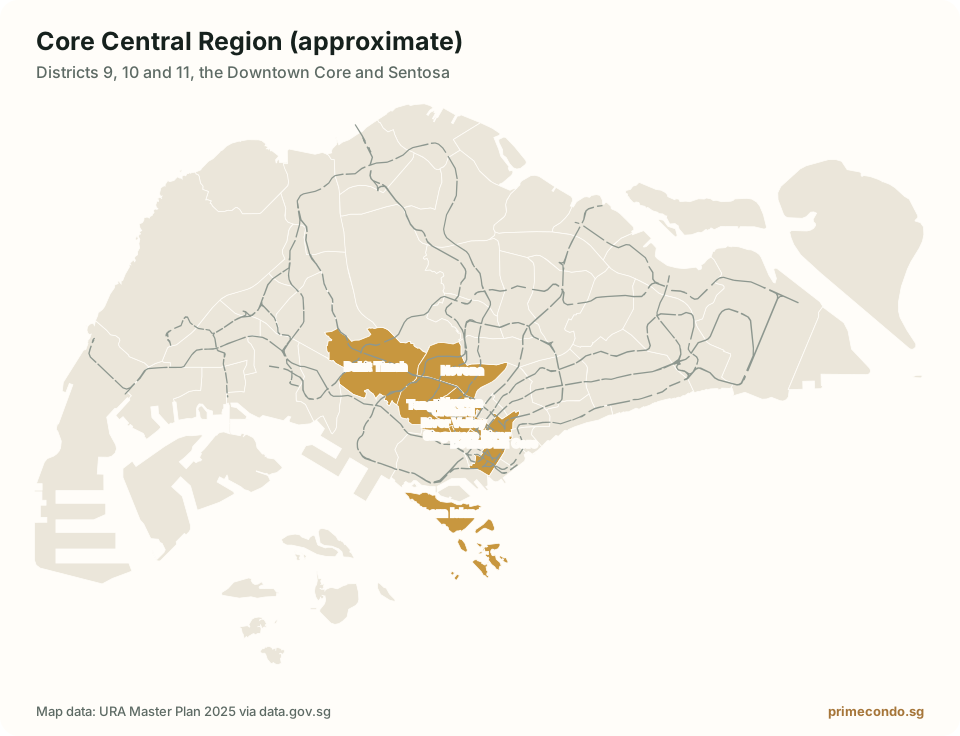
- The CCR is postal districts 9, 10 and 11, plus the Downtown Core and Sentosa.
- The RCR is the rest of the Central Region. The OCR is everything outside it.
- Since 2009, OCR condo prices have risen much faster than CCR prices, so the prime premium has narrowed.
- The CCR has the highest rents per square foot but the lowest rental yields.
Property reports in Singapore constantly refer to the CCR, RCR and OCR. They are the three market segments the Urban Redevelopment Authority (URA) uses to report prices, rents and sales of private homes.
The three regions
| Segment | Also called | What it covers |
|---|---|---|
| CCR Core Central Region | Prime | Postal districts 9, 10 and 11, the Downtown Core planning area and Sentosa |
| RCR Rest of Central Region | City fringe | The rest of URA’s Central Region, outside the CCR |
| OCR Outside Central Region | Suburbs, mass market | Everything else: the north, north-east, east and west |
Which districts fall where
Postal districts and URA regions were drawn for different purposes, so some districts straddle two segments. As a guide:
- CCR: D9 Orchard and River Valley, D10 Tanglin and Bukit Timah, D11 Novena and Newton, the Marina Bay and Raffles Place parts of D1 and D2, D6, and Sentosa in D4.
- RCR: D3, mainland D4, D7, D8, D12, D13, D14, most of D15, Bishan in D20 and parts of D5 and D21.
- OCR: D16 to D19, D22 to D28, and the remaining parts of D5, D20 and D21.
To check a specific project, look it up in URA’s transaction records, which label every sale with its market segment.
How prices have moved
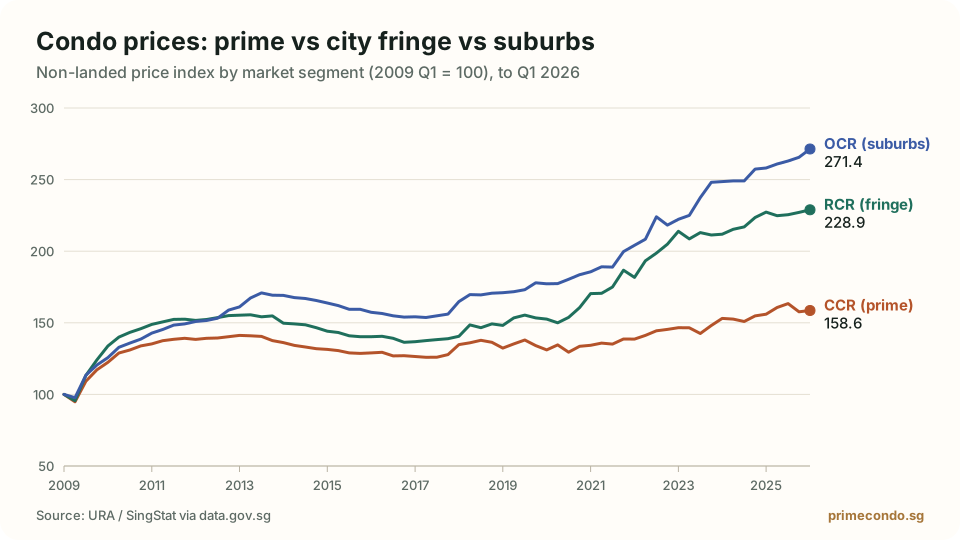
Set all three segments to 100 in the first quarter of 2009 and follow them to Q1 2026:
- CCR: up about 59%
- RCR: up about 129%
- OCR: up about 171%
Suburban prices have risen nearly three times as fast as prime prices. Three things explain most of the gap:
- ABSD hits the CCR hardest. Foreign buyers and investors with several properties have always been a larger share of prime demand. Each round of ABSD increases, especially the 60% rate for foreigners in 2023, removed part of that demand.
- HDB upgraders buy in the OCR and RCR. Rising resale flat prices gave upgraders more equity to spend, and they mostly spend it near where they already live.
- New MRT lines closed the convenience gap. The Downtown, Thomson-East Coast and Circle lines brought many suburban estates within a short ride of the city.
The result is that the price premium for a prime address is smaller than it has been in decades. Some buyers read that as value in the CCR; others read it as a lasting shift in demand.
How rents compare
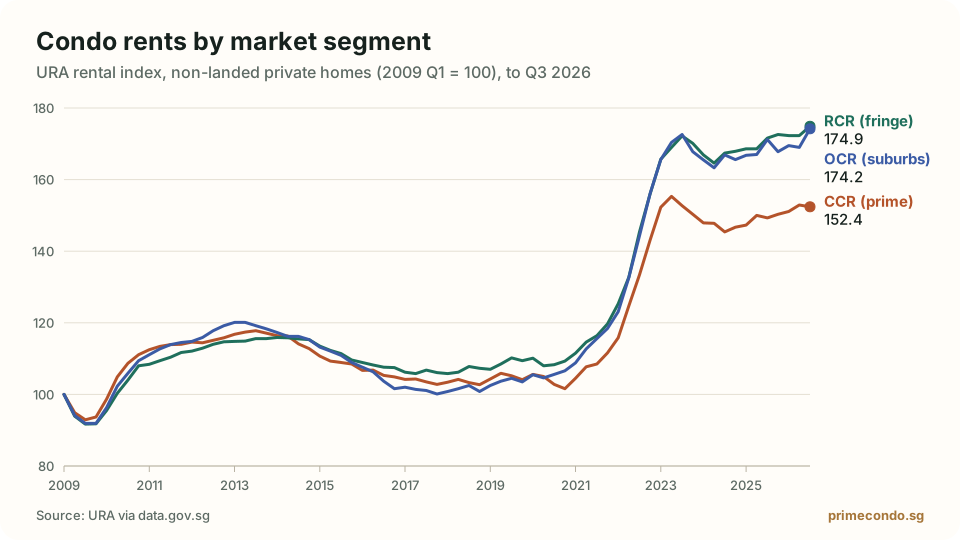
Over the past year the URA rental index moved by +2.1% in the CCR, +1.9% in the RCR and +1.8% in the OCR.
Prime homes rent for more per square foot, but they cost much more to buy, so gross rental yields are usually lowest in the CCR and highest in the OCR. You can compare actual rents by district on our condo rental prices page.
Sales activity by region
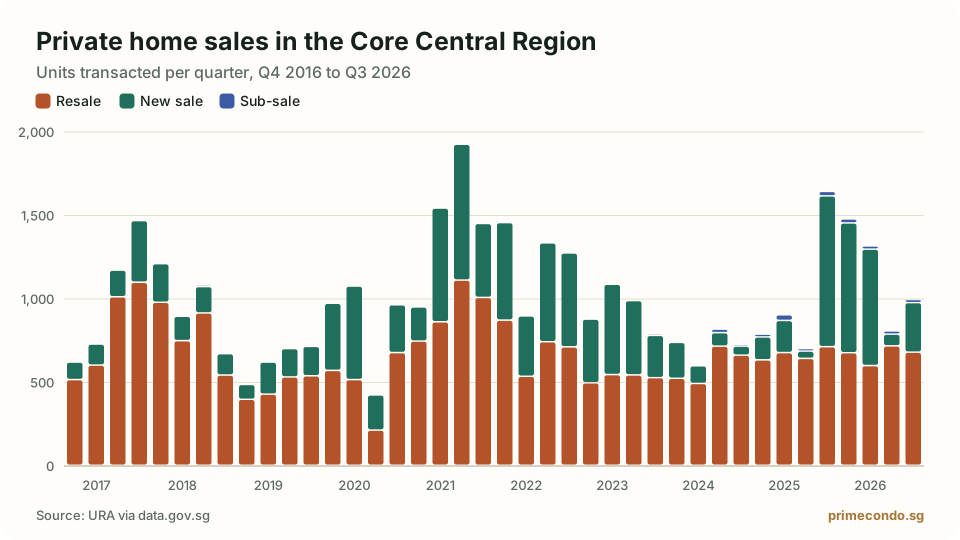
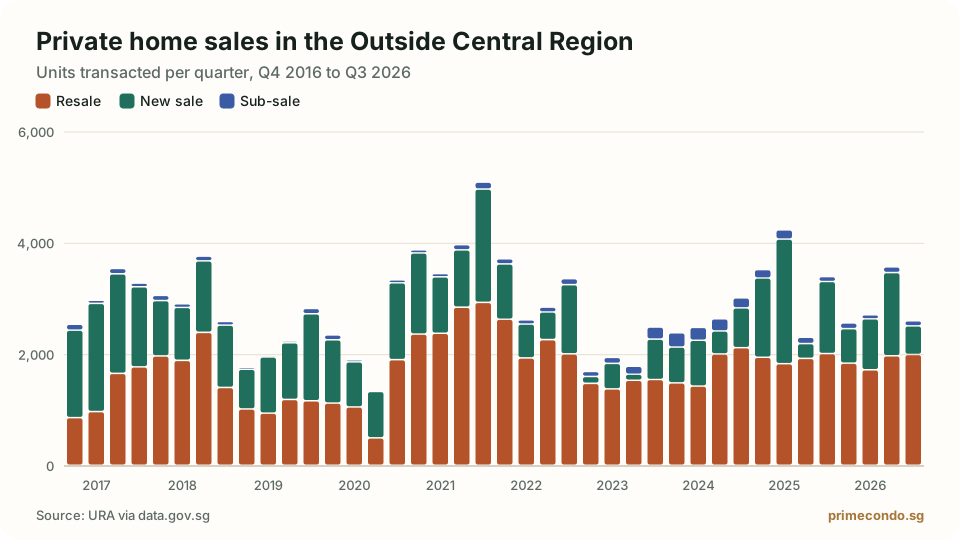
The CCR is a much thinner market. Fewer units change hands each quarter, so prices can be more volatile and a unit can take longer to sell. See the full picture on the market data page.
Which should you choose?
- Choose CCR if you want a central address for the long term, value freehold tenure and scarcity, and are less concerned about yield.
- Choose RCR for a balance: a short commute, a wide choice of new launches and prices between the two.
- Choose OCR if you want the most space for your budget, are upgrading from an HDB flat nearby, or want the deepest pool of future local buyers.
Frequently asked questions
Which districts are in the CCR?
Postal districts 9, 10 and 11, the Downtown Core planning area (which covers parts of districts 1, 2, 6 and 7) and Sentosa in district 4.
Is the RCR the same as the city fringe?
Yes. The Rest of Central Region is commonly called the city fringe. It includes areas such as Queenstown, Tiong Bahru, Toa Payoh, Geylang, Kallang, Marine Parade and Bishan.
Is CCR property a better investment than OCR?
Neither is better in general. CCR homes carry prestige and scarcity but have appreciated more slowly since 2009 and rely more on foreign and investor demand. OCR homes are supported by local upgraders and have seen stronger price growth. The right choice depends on budget, holding period and whether you plan to live in the unit.
Does the region affect stamp duty or loans?
No. Stamp duty and loan limits are the same across Singapore. The regions are a statistical classification used by URA.
Sources
- URA: Private residential property statistics
- data.gov.sg: Price index of non-landed private residential properties by locality
This guide is general information, not tax, legal or financial advice. Rules change; check the official source before you commit.
Keep reading
Freehold vs 99-year leasehold condos in Singapore
What tenure really changes: price, loans, CPF limits and what happens as a lease runs down.
BuyingNew launch vs resale condo: which should you buy?
Payment schedules, price per square foot, space and risk compared side by side.
RentingRenting a condo in Singapore: prices, rules and process
Median rents by district from URA data, and how the leasing process works from letter of intent to handover.