1. Home
  2. Market data
Market data · Q3 2026

Singapore private property market in charts

Prices, rents, sales and supply from URA’s quarterly statistics. Rebuilt whenever new data is released.

Data refreshed
Condo prices, quarter
+1.0%Q3 2026 vs previous quarter
Condo prices, year
+2.0%vs same quarter last year
Condo rents, year
+1.9%Q3 2026
Unsold pipeline
19,076private homes, Q3 2026

Prices

The URA Private Residential Property Price Index tracks what private homes actually sell for. The non-landed index, which covers condos and apartments, stood at 212.7 in Q3 2026 (2009 Q1 = 100). That is +2.0% over a year and +33.0% over five years.
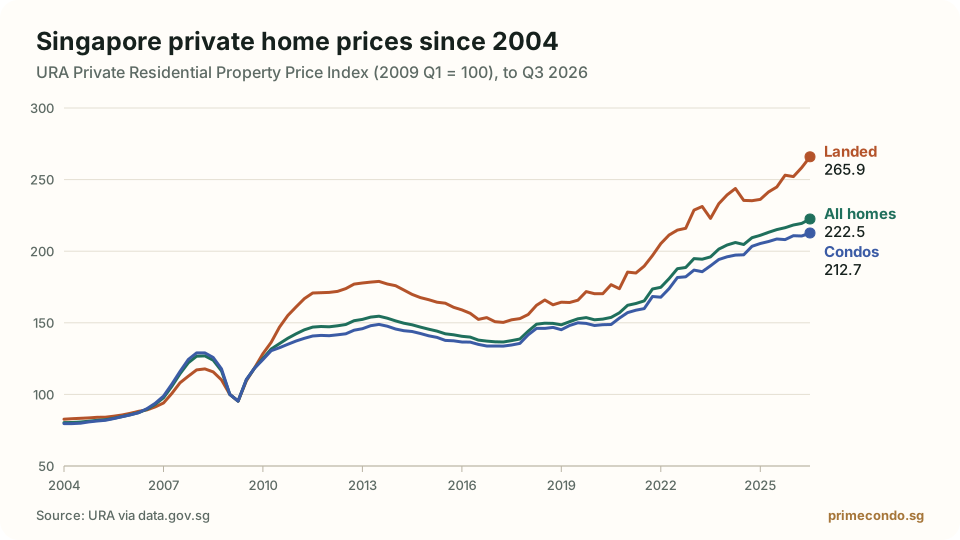
Line chart of the URA private residential property price index from 2004 to Q3 2026, for all homes, landed and non-landed
URA price index for private homes. 2009 Q1 = 100.

Prime, city fringe and suburbs

Suburban condos have appreciated far more than prime ones since 2009. Why the gap has narrowed.
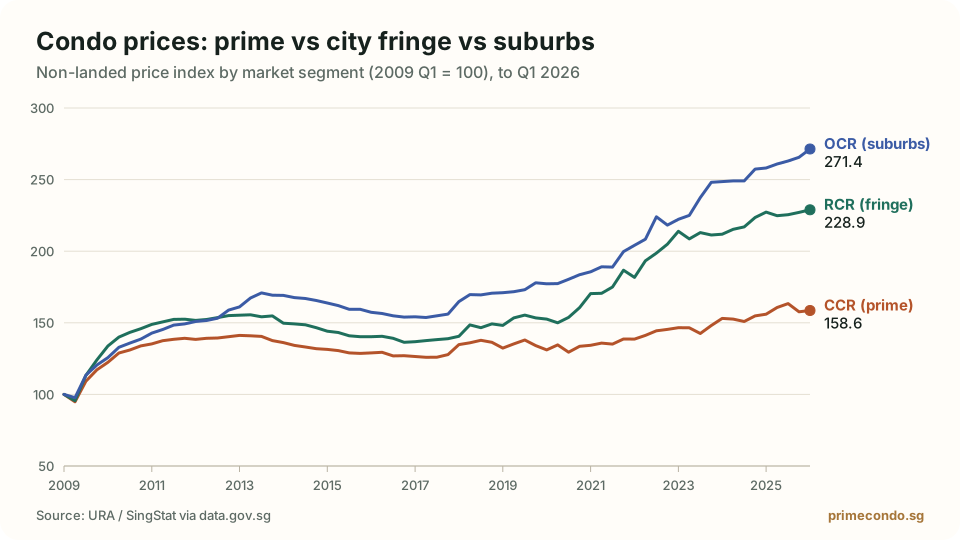
Line chart comparing condo price indices for the Core Central Region, Rest of Central Region and Outside Central Region from 2009 to Q1 2026
Since 2009, suburban (OCR) condo prices have risen far faster than prime (CCR) prices, narrowing the gap between them.

Rents

Over the year to Q3 2026, condo rents moved by +2.1% in the CCR, +1.9% in the RCR and +1.8% in the OCR. For rents by development, use the rental price search.
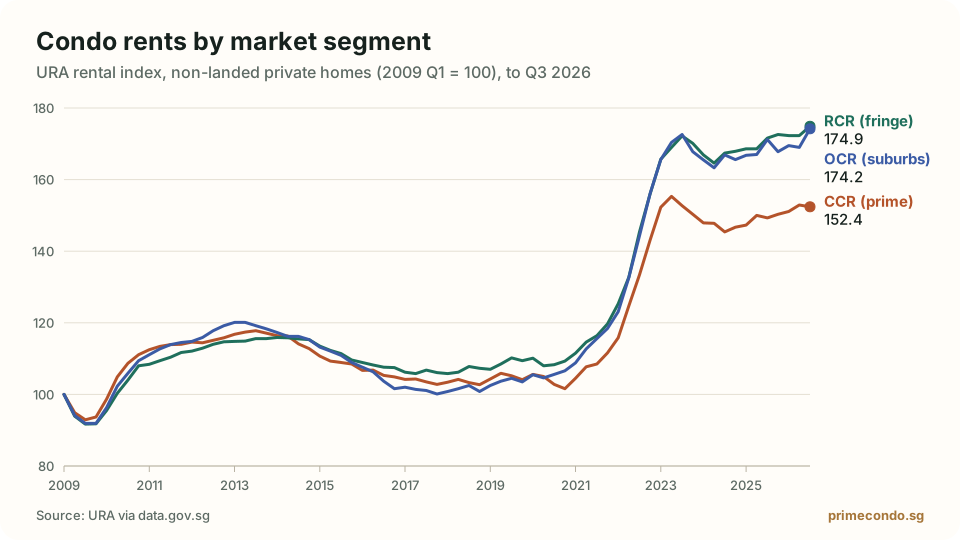
Line chart of the URA condo rental index by market segment from 2009 to Q3 2026
Condo rents jumped in 2022–2023 and have been broadly flat since.
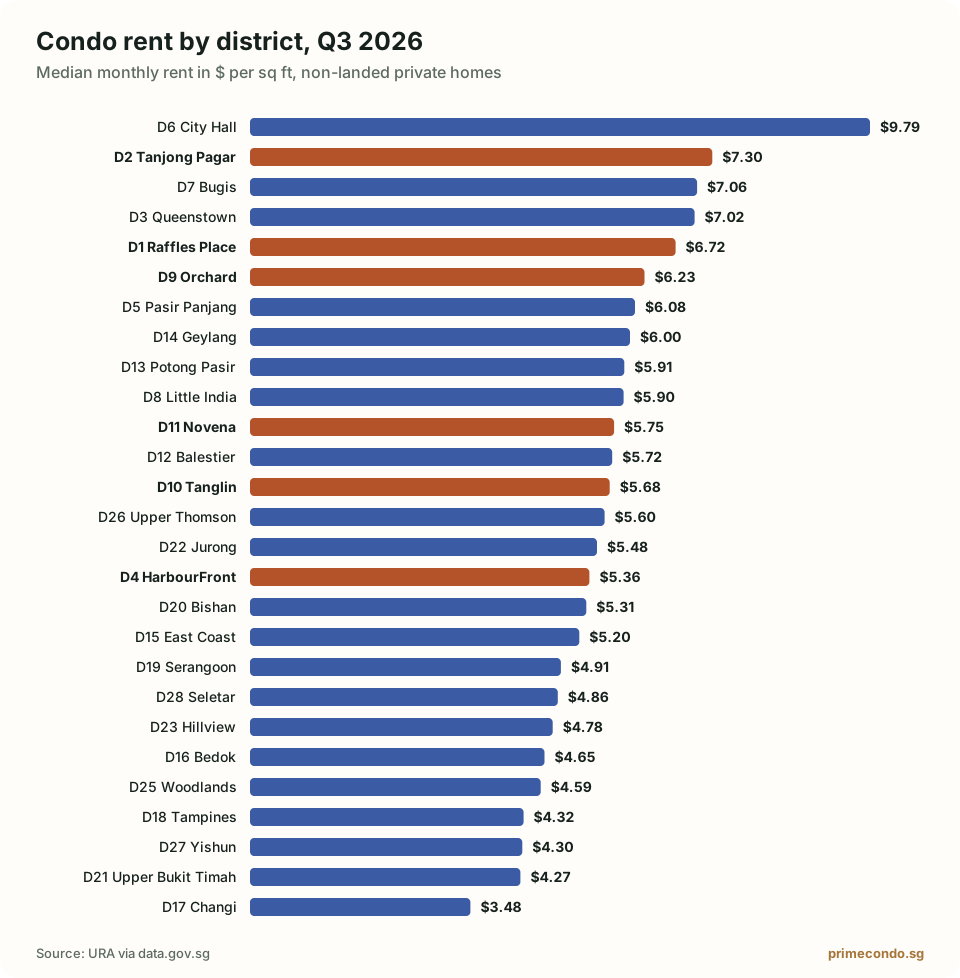
Bar chart ranking Singapore postal districts by median condo rent per square foot per month, Q3 2026
Median monthly condo rent by district. Prime districts are shown in terracotta.

Sales volume

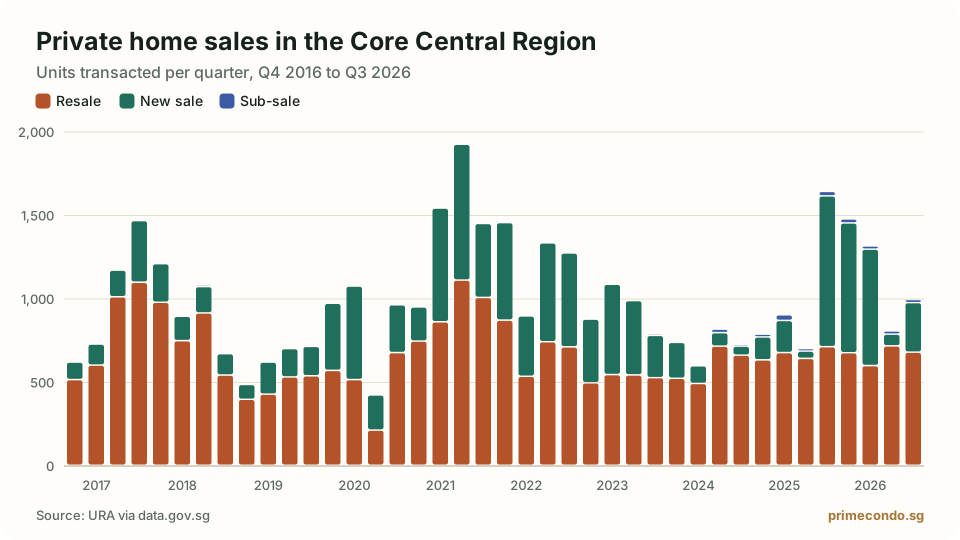
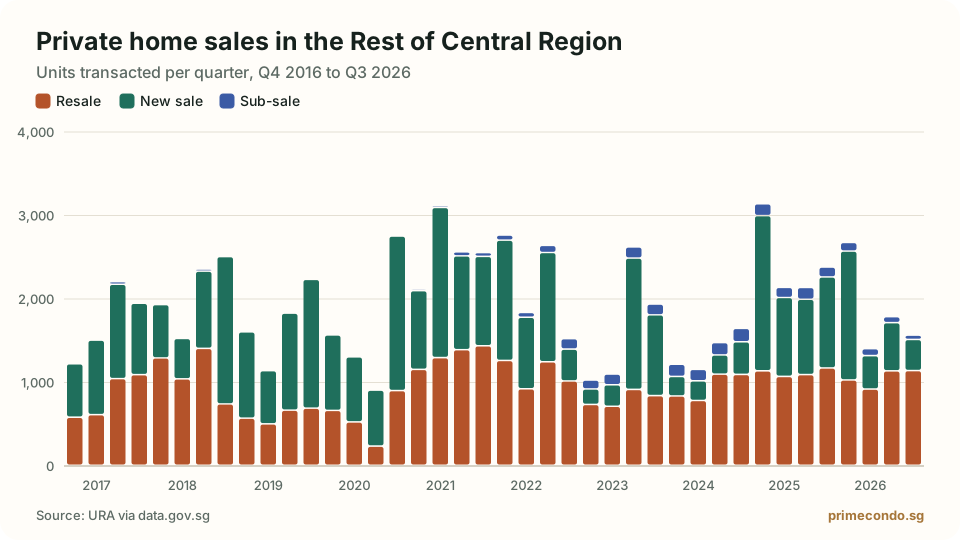
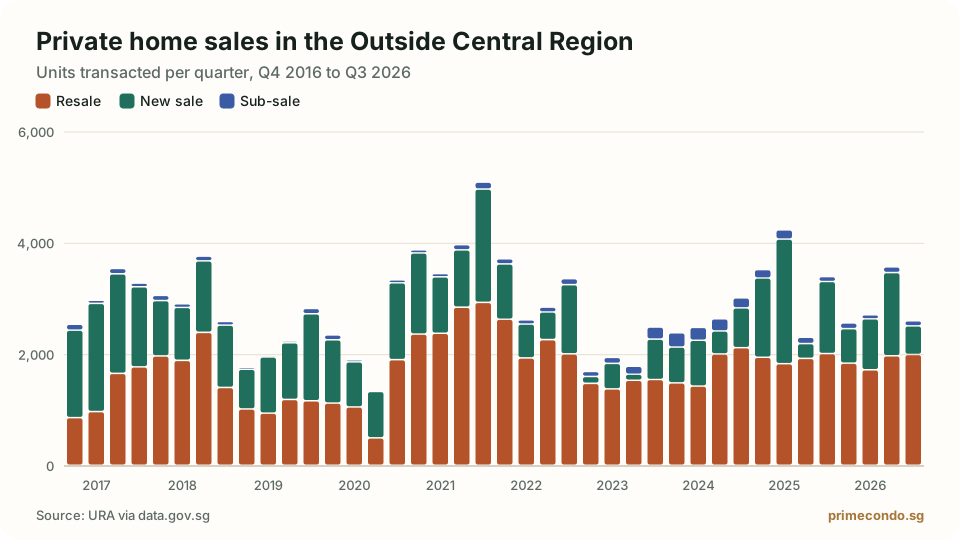
Q3 2026New saleResaleSub-saleTotal
CCR Core Central Region29767719993
RCR Rest of Central Region3721,134521,558
OCR Outside Central Region5141,990912,595
Stacked column chart of private home sales in the Core Central Region by quarter, split into new sales, resales and sub-sales, Q4 2016 to Q3 2026
Quarterly private home transactions in the Core Central Region (CCR).
Stacked column chart of private home sales in the Rest of Central Region by quarter, split into new sales, resales and sub-sales, Q4 2016 to Q3 2026
Quarterly private home transactions in the Rest of Central Region (RCR).
Stacked column chart of private home sales in the Outside Central Region by quarter, split into new sales, resales and sub-sales, Q4 2016 to Q3 2026
Quarterly private home transactions in the Outside Central Region (OCR).

Supply

At the end of Q3 2026 there were 19,076 unsold private homes with planning approval: 5,284 in the CCR, 6,899 in the RCR and 6,893 in the OCR. A large unsold pipeline tends to restrain price growth; a thin one supports it.
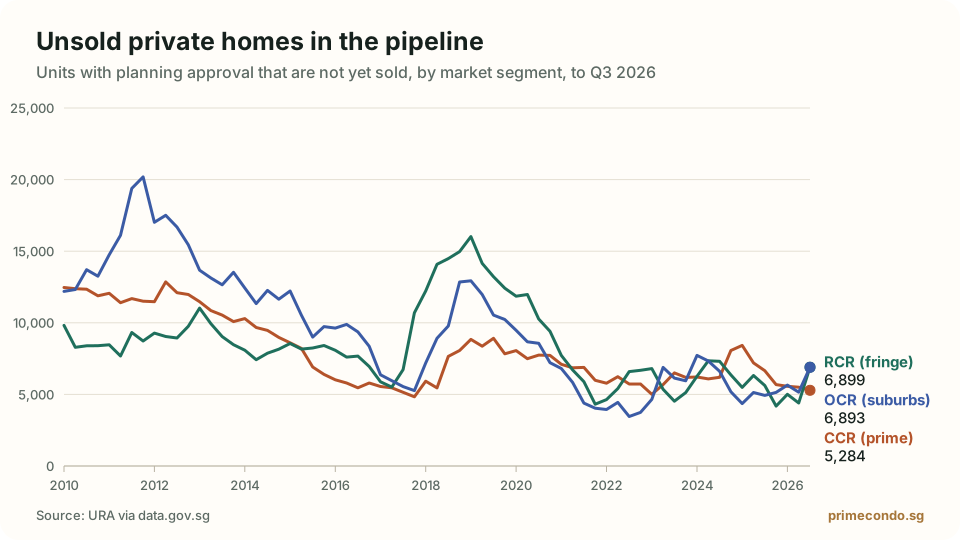
Line chart of unsold private residential units with planning approval by market segment, 2010 to Q3 2026
Unsold units in the pipeline (completed and uncompleted, with planning approval).

Stamp duty collected

ABSD receipts show how active second-home and foreign buyers have been. How ABSD works.
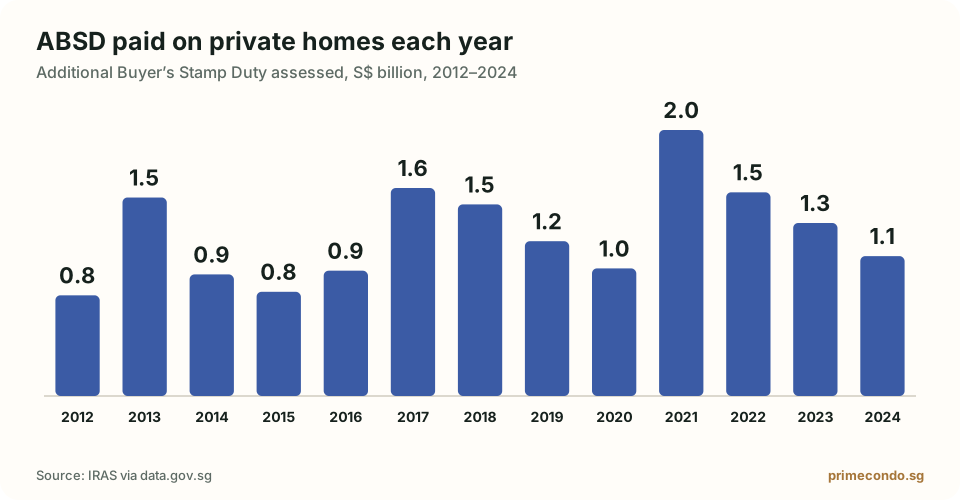
Column chart of Additional Buyer’s Stamp Duty assessed on private homes in Singapore each year from 2012 to 2024
ABSD assessed on private residential purchases by calendar year.

Sources and method

  • URA: Private Residential Property Price Index; Rental Index; transactions by market segment; unsold units with planning approval
  • SingStat: Price index of non-landed private residential properties by locality
  • IRAS: Stamp duty assessed for private residential properties

All series are downloaded from data.gov.sg under the Singapore Open Data Licence. Indices are rebased by the publisher to 2009 Q1 = 100. Percentage changes are calculated by us from the published index values. Recent quarters may be revised by URA.