Buy or rent a Singapore condo knowing the numbers
District guides, official URA rent and price data, and calculators for stamp duty and loans. Independent, free and checked against IRAS and MAS.
- Condo prices, past year
- +2.0%URA non-landed index, Q3 2026
- Condo prices, 5 years
- +33.0%to Q3 2026
- Condo rents, past year
- +1.9%URA rental index, Q3 2026
- Median condo rent
- $5.53per sq ft per month, Q3 2026
Source: URA via data.gov.sg. See all market charts
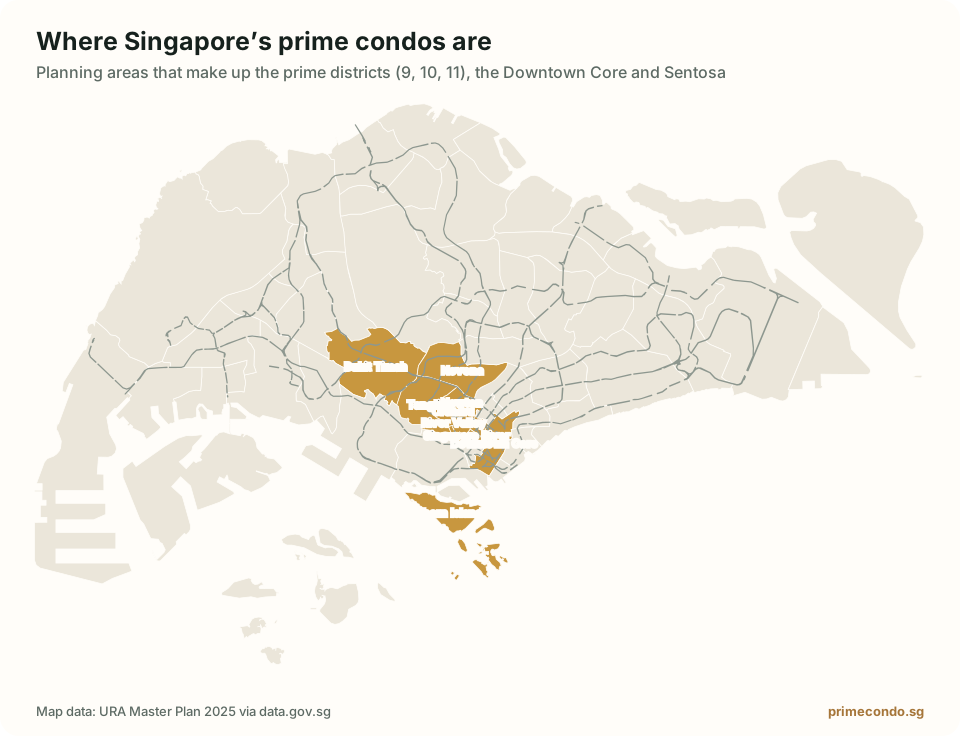
The prime districts
Where Singapore’s most valuable condos are: the Core Central Region and the waterfront.
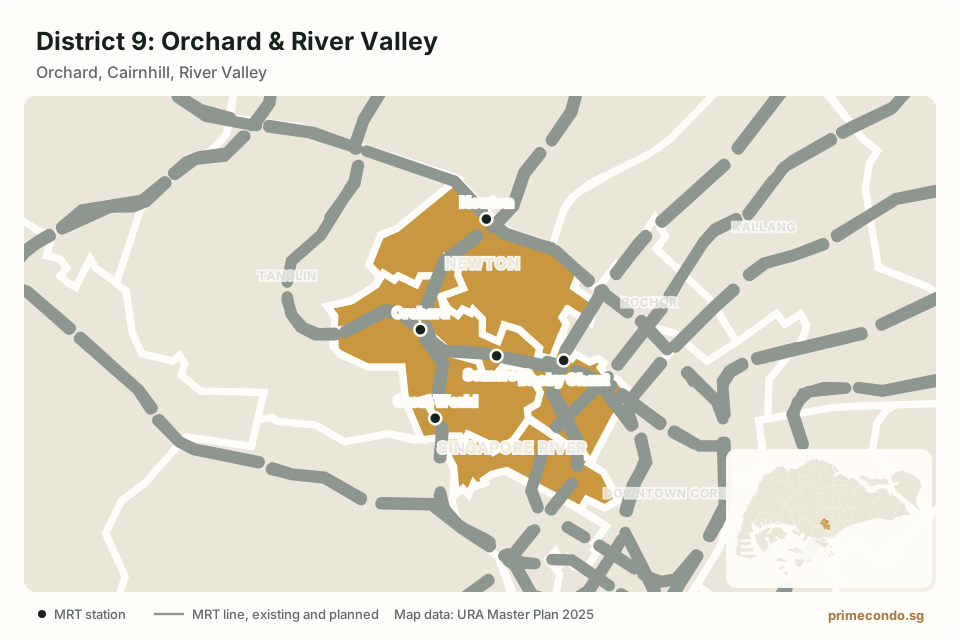
Orchard & River Valley
District 9 is the address most people picture when they think of prime Singapore property.
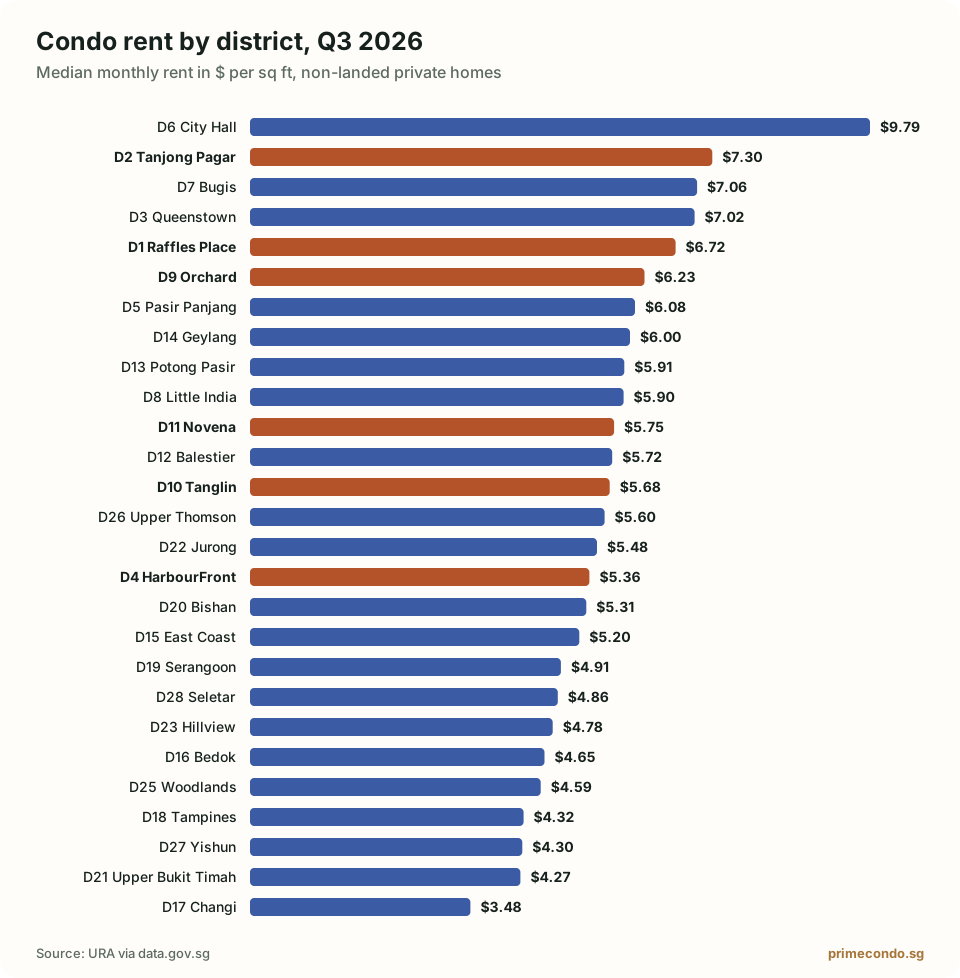
$6.23 psf median rent · 90 developments
District guide →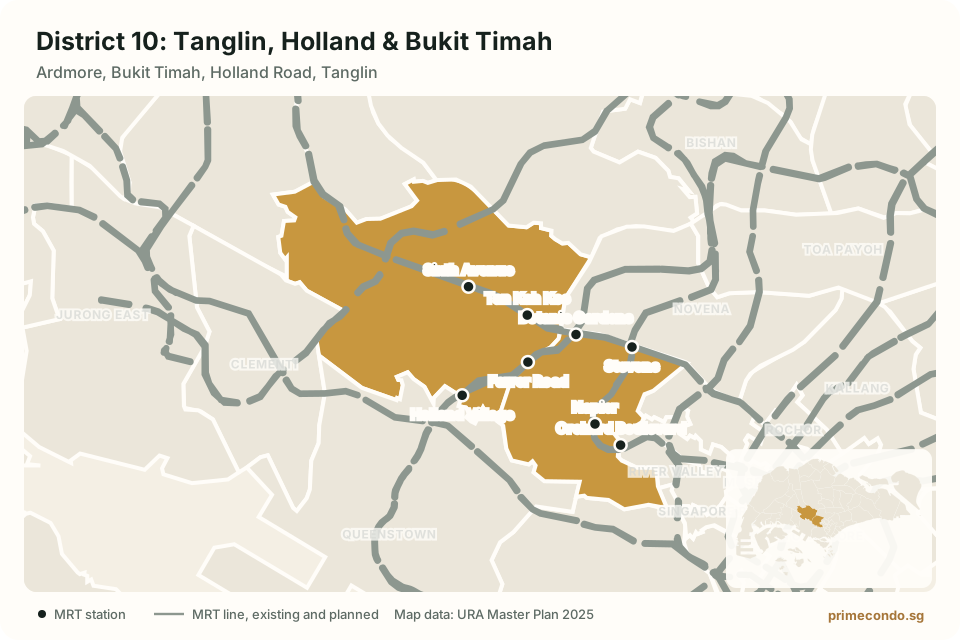
Tanglin, Holland & Bukit Timah
District 10 is Singapore’s most established residential enclave.
$5.68 psf median rent · 85 developments
District guide →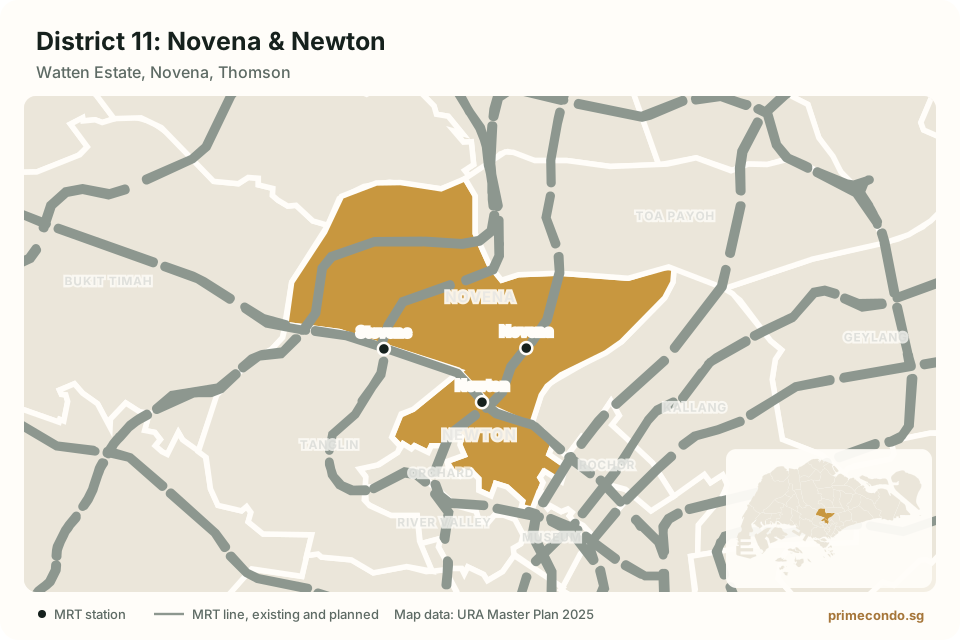
Novena & Newton
District 11 offers a prime address at a discount to its neighbours in Districts 9 and 10.
$5.75 psf median rent · 38 developments
District guide →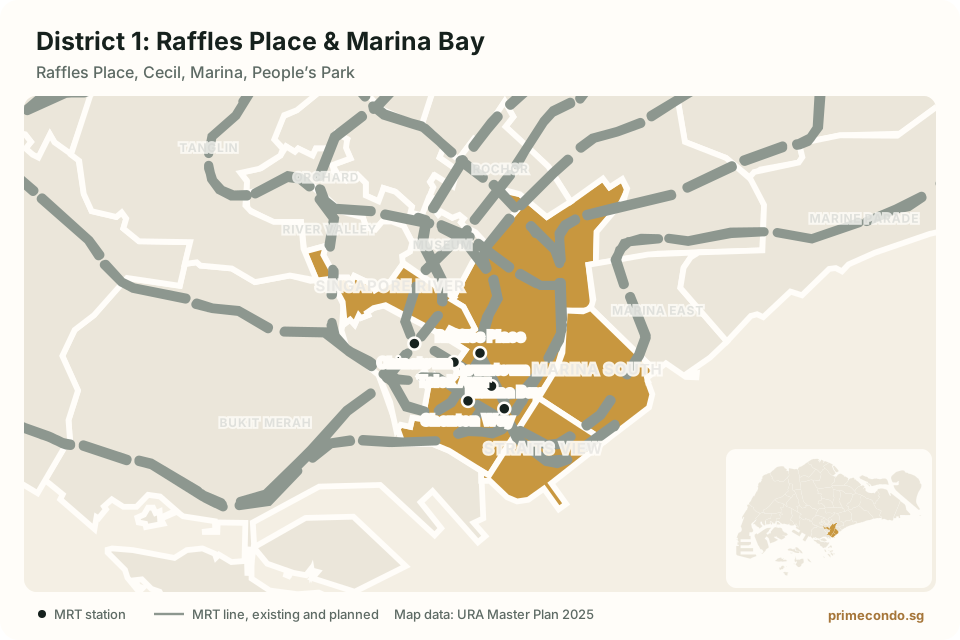
Raffles Place & Marina Bay
District 1 is Singapore’s financial centre.
$6.72 psf median rent · 11 developments
District guide →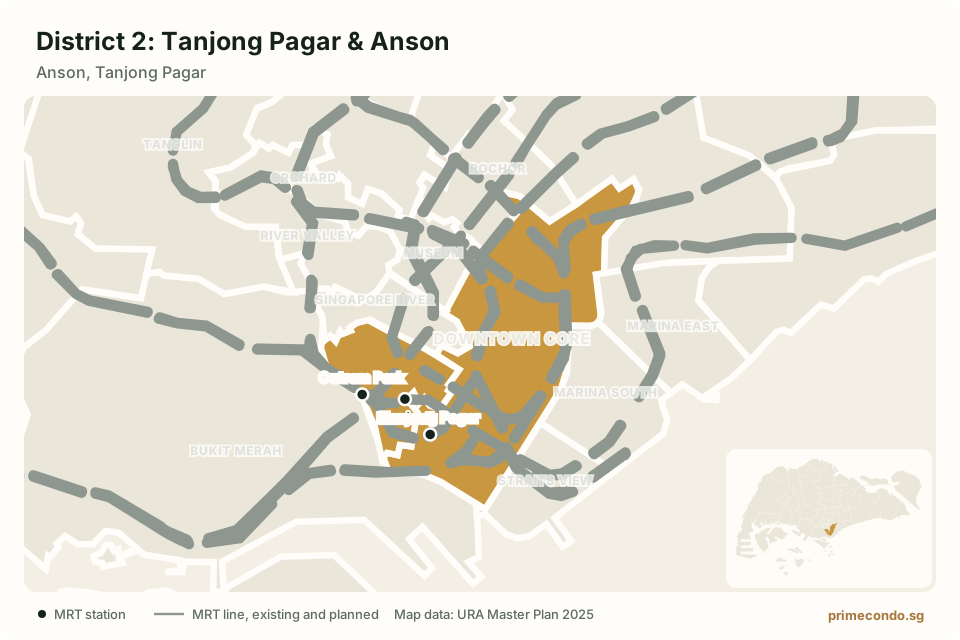
Tanjong Pagar & Anson
District 2 sits at the southern end of the CBD.
$7.30 psf median rent · 14 developments
District guide →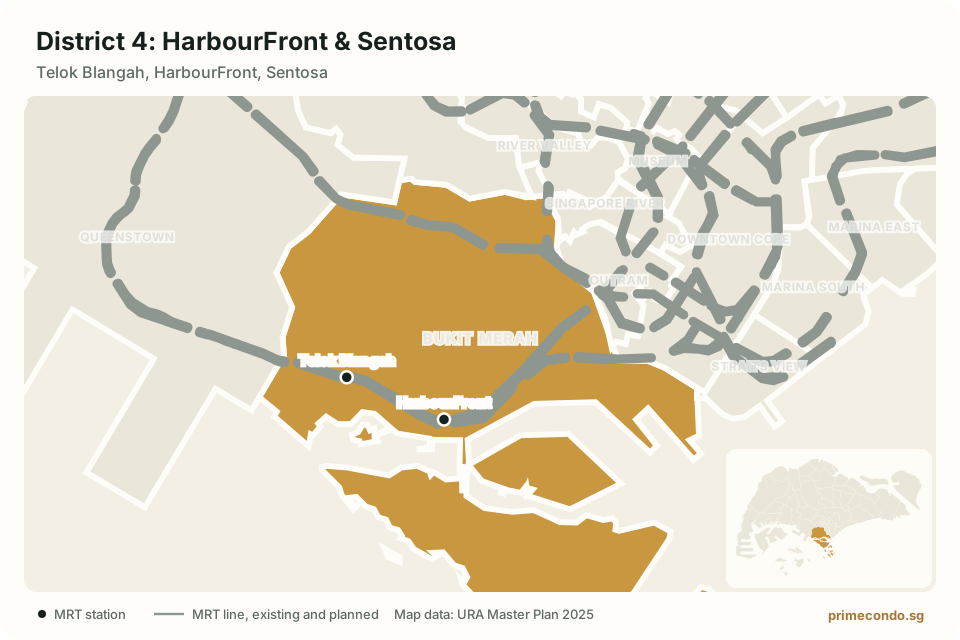
HarbourFront & Sentosa
District 4 is Singapore’s waterfront district.
$5.36 psf median rent · 18 developments
District guide →Calculators
Work out the real cost before you view. Built on current IRAS and MAS rules.
Stamp duty calculator
Duty for citizens, PRs, foreigners and entities at any price.
Calculate →TDSR + LTVAffordability calculator
Your maximum loan and price from income, debts and savings.
Calculate →SSDSeller’s Stamp Duty calculator
Whether SSD applies and the date your holding period ends.
Calculate →Guides for buyers
Plain-English answers, with every rate checked against the official source.
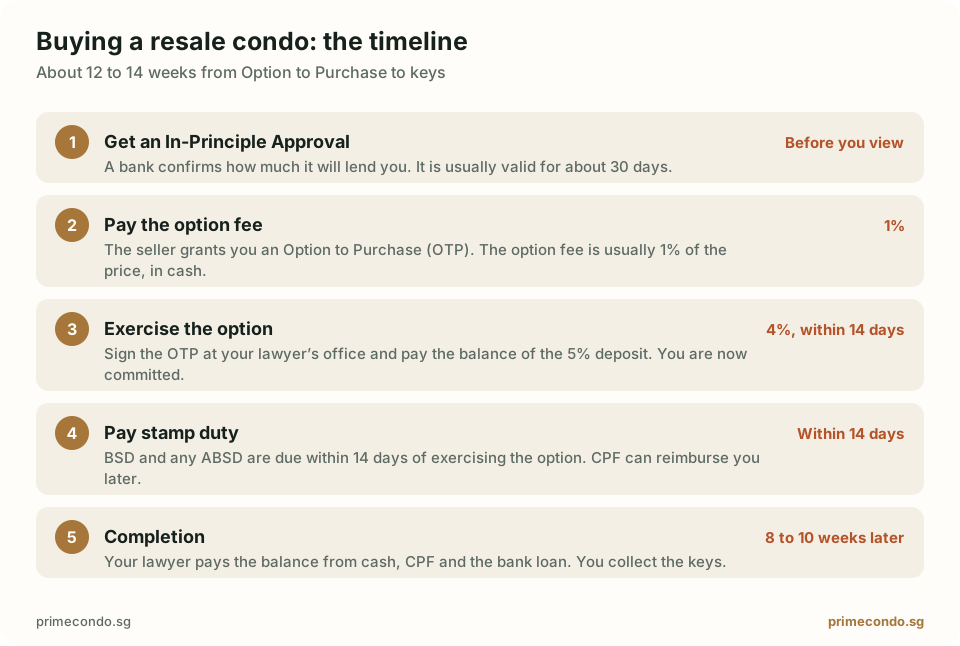
How to buy a condo in Singapore: step by step
From loan approval to collecting keys: the timeline, the paperwork and all the costs.
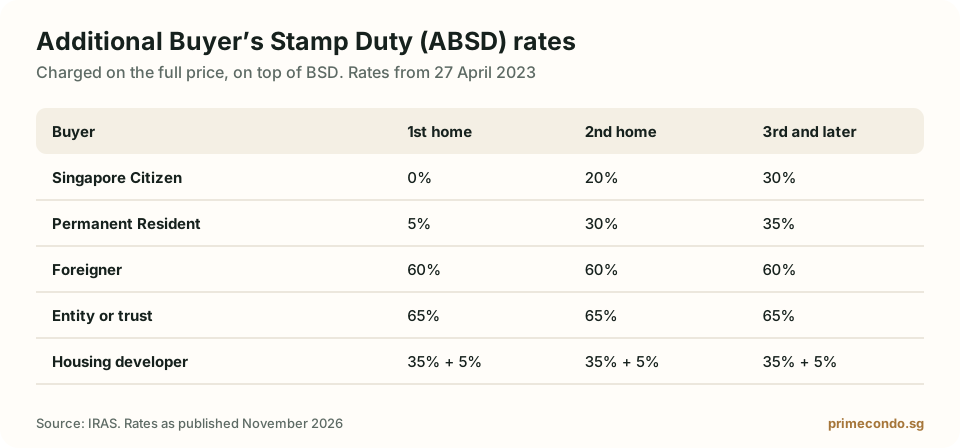
ABSD in Singapore: rates, remissions and worked examples
Current ABSD rates for every buyer profile, how joint purchases are taxed, and the refund rules for married couples.
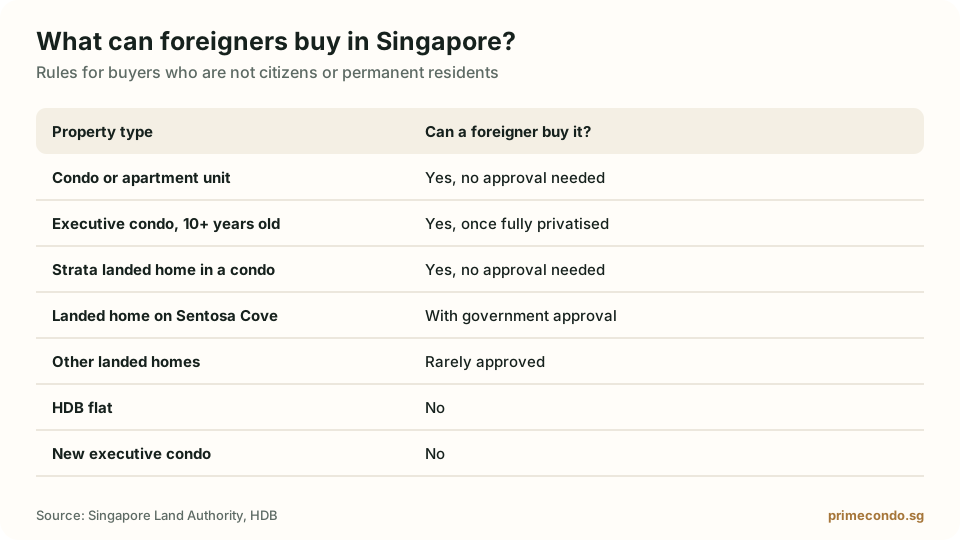
Can foreigners buy property in Singapore?
What foreigners can buy, the 60% ABSD, who is exempt under free trade agreements, and how loans work.
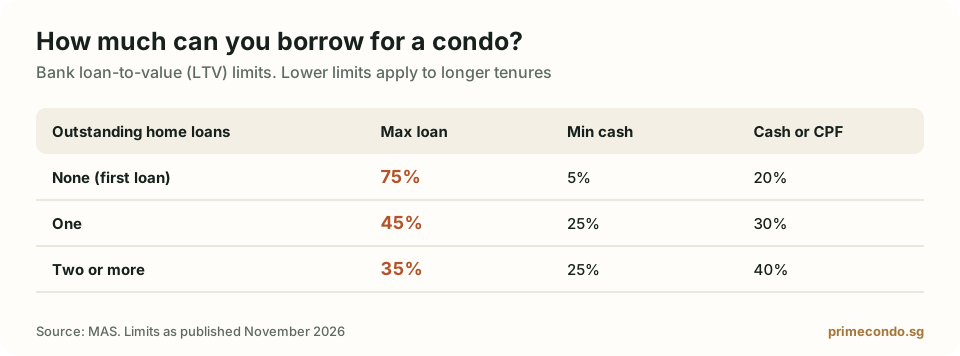
How much condo can I afford in Singapore?
How banks work out your maximum loan, and how much cash and CPF you need at each price.
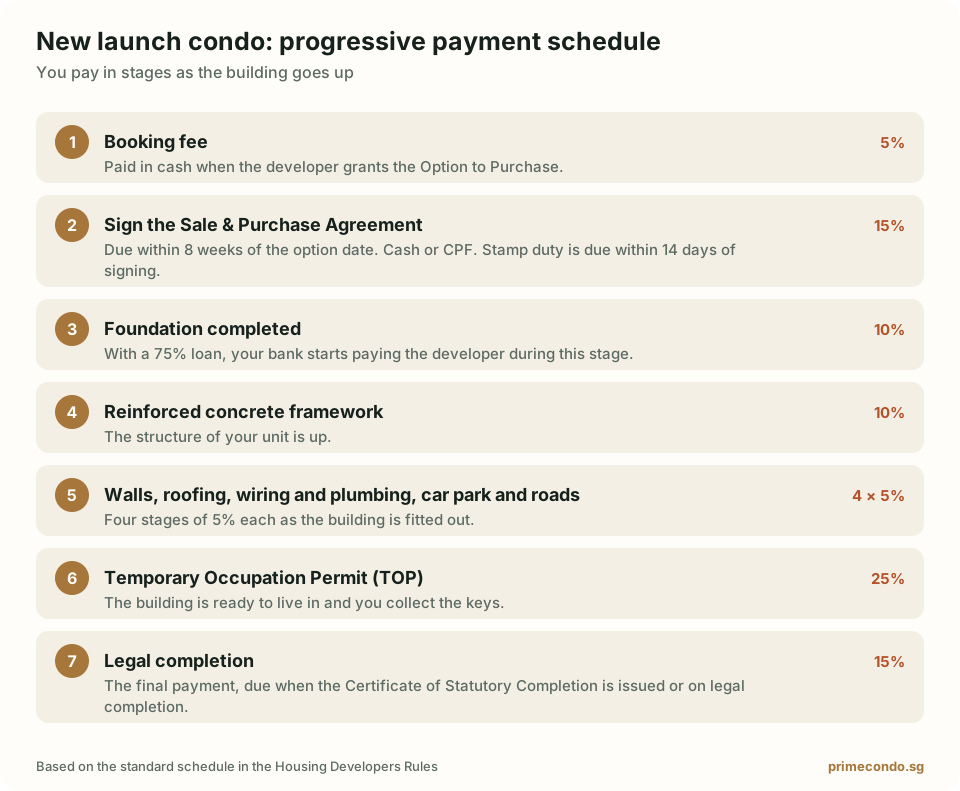
New launch vs resale condo: which should you buy?
Payment schedules, price per square foot, space and risk compared side by side.
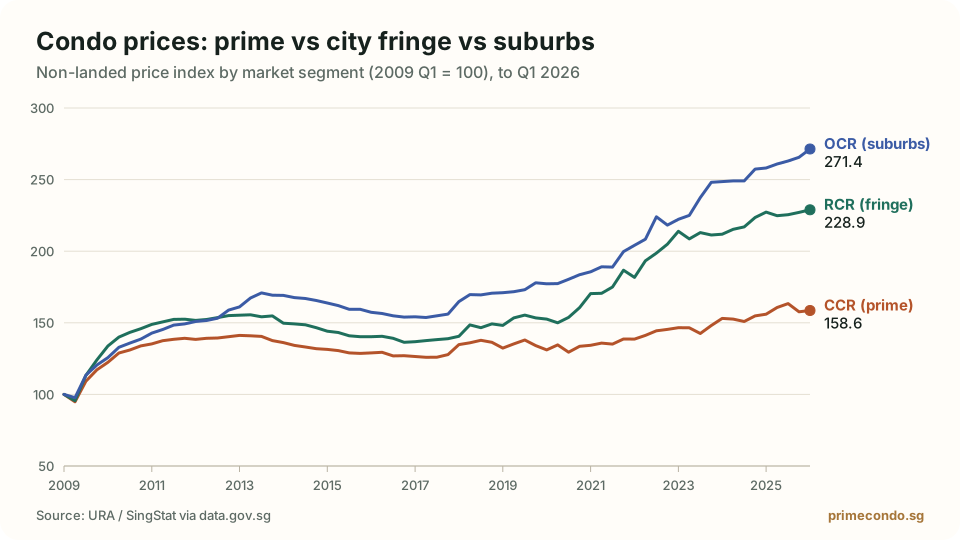
CCR, RCR and OCR explained: Singapore’s three property regions
Which districts are prime, city fringe or suburban, and how prices in each have moved since 2009.
What every condo rents for
Median rents for 743 developments, straight from the rental contracts URA publishes each quarter. Search by condo name or filter by district.
Why trust this site
Official data only
Prices, rents and sales figures come from URA, IRAS and SingStat through data.gov.sg. We show the source and the quarter on every chart.
Rules checked at the source
Stamp duty, property tax and loan limits are verified against IRAS and MAS, and each guide shows when it was last updated.
Independent
No listings to push and no developer sponsorship. The aim is to help you understand a purchase before you speak to anyone selling one.